Original source: https://www.ocerra.com/post/how-to-create-accounts-payable-aging-report-using-microsoft-power-bi
Prerequisites: Download Power BI for Desktop. A free business intelligence tool from Microsoft.
One of the most used ways to visualize data in Power BI is by using Open Data Protocol (OData) connection. In Ocerra, we support OData out of the box and provide secured access to your data.
Connecting to your company
Power BI allows you to connect to Ocerra and consume metadata from the application site:

Connect to OData feed using the public URL:

Enable Basic authentication using your login and password:

Select all required tables Voucher Header and Workflow State if you want to filter by Approved status. In Ocerra we keep all supplier invoices in tables called Voucher. This term might be unfamiliar for a larger accounting audience. The Voucher is an internal document that combines all related data to the supplier invoice, including Vendor (Supplier), linked Purchase Orders, Workflow Status, Payments, and so on.

On this next step, we are Transforming Data and removing all non-required columns. Then, we expand some additional tables to make our reports friendly. Using the table expand feature from Power BI we can expand up to 3 tables up in the hierarchy, i.e. Voucher -> Supplier -> Name.

As I’m planning to build my report in the local currency, I’m going to exclude Currency Columns and other non-related fields. In Ocerra, we automatically calculate local currency value for all invoices using the pre-defined or automatic currency rates.

To make our report relative to the current date, we’re going to add new columns. The first column will calculate a relative number of days from today to the Due date using a simple formula:
= Duration.Days(Date.From([DueDate]) - Date.From(DateTime.LocalNow()))

In the next step, we’re planning to group our days in bins. You can vary the size of your bin as per your payment schedule. In the demo, I’m using 7, 14, 20, 30+ day bins.
The smart invoice processing brings transparency in your payment process and enhances your cashflow.

Here is the final data transform step, I promise this is the last one advanced BI feature in this demo. Using the Pivot function, we’re able to make columns out of Periods and aggregate the values for our invoices by period.

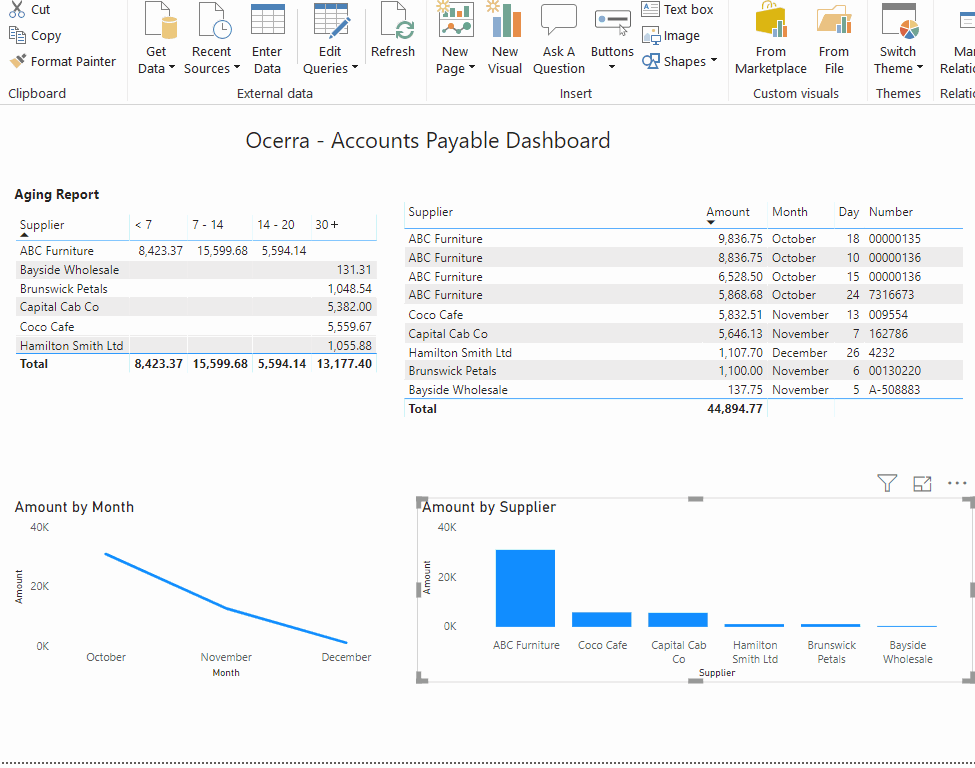
Finally, let’s build our dashboard. You can publish this dashboard over your Office 365 account or just use it from Power BI Desktop.